Microlight » Meteorology » Atmospheric Pressure & Density
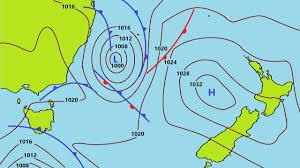
Synoptic Map
To help in the forecasting of weather conditions, the meteorologist prepares charts showing various pressure systems.
The information needed is drawn from readings of the local surface pressure at different reporting stations.
By joining places of equal pressure with lines known as isobars, it is possible to produce a synoptic chart from which the pressure distribution can be determined.
When the isobar patterns have been drawn, it is found that they have tended to form themselves into areas, or systems, of either relatively low pressure or relatively high pressure.
By convention, the isobars are normally drawn at intervals of 2 or 4 hPa, with 4 hPa intervals being more commonly used.
Frontal systems are also plotted on the chart.
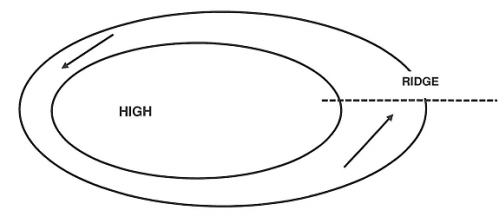
Anticyclones (Areas of High Pressure)
An anticyclone, or high, is an atmospheric pressure system in which there is a high central pressure relative to the surroundings.
It is characterised on a synoptic chart by a system of closed isobars, generally approximately circular or oval in form, enclosing the central high pressure.
The circulation of winds about the centre is anticlockwise in the southern hemisphere.