
Microlight » Meteorology » Weather Maps
Weather Maps
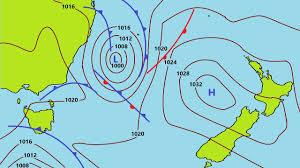
A surface weather map shows the position and movement of weather systems.
It may show:
- areas of high and low pressure;
- isobars;
- warm and cold fronts;
- ridges; and
- troughs.
In New Zealand, weather systems generally move from west to east.
Isobars
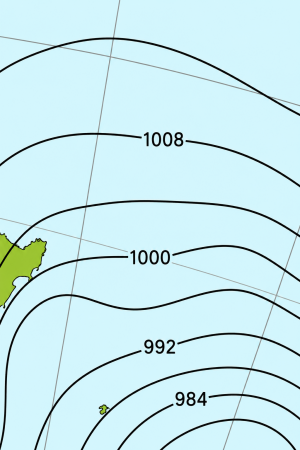
Isobars are lines on a weather map connecting points of equal atmospheric pressure.
The spacing of the isobars gives an indication of wind strength.
Isobars spaced far apart:
- weak pressure gradient;
- generally lighter winds.
Isobars spaced close together:
- strong pressure gradient;
- generally stronger winds.
Remember:
Tightly packed isobars = strong winds.
Anticyclone – High
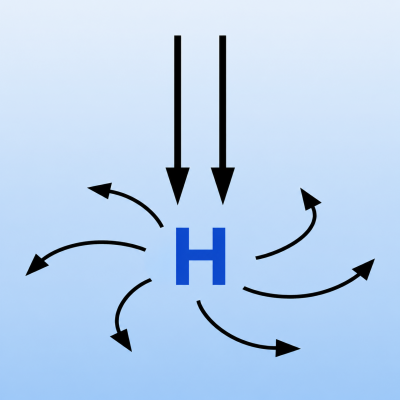
An anticyclone, or high, is an area of high atmospheric pressure.
In the Southern Hemisphere, winds circulate anticlockwise and outwards around a high.
- Air generally sinks.
- Pressure is highest towards the centre.
- Winds generally flow outwards.
- Highs tend to be large and slow-moving.
- They are generally associated with widespread, longer-term settled weather and lighter winds.
On a weather map, a high-pressure system is identified by an H.
Depression – Low
A depression, or low, is an area of low atmospheric pressure.
To see more, you must subscribe for licence "Microlight" or sesssion "Meteorology"